We start with some important preliminaries. First, by way of several examples, we provide a definition of empirical research and identify its unique features. Second, we ask you to perform a thought experiment with us—one designed to illuminate the problems with all empirical studies, as well as the solutions social scientists have devised. We end with a discussion of the various goals of empirical research.
1.1 Defining Empirical Research
In the not-so-distant past, women couldn't practice law in many societies much less become a judge.
1
Today, at least one female judge serves on many if not most high courts throughout the world.
2
Even more stunning, of the nearly 51,000 judges sitting on courts of first instance in Europe, 56% are women.
3
These are facts no one debates, but there is considerable controversy over their significance for the law.
To some scholars, judges, and lawyers, an increasingly diverse federal bench may have symbolic value but it is irrelevant to the task of judging.
On this account, judges reach decisions by reference to legal materials.
If a case is novel, the judges' ideology may come into play
4 but not their gender or other personal-identity characteristics.
To other commentators, gender is far from irrelevant; it can have a profound influence on the development of the law because, they argue, female judges decide cases differently than male judges.
5
To provide one example, perhaps female judges are more sympathetic than their male colleagues to claims of sex discrimination in the workplace.
6
How might we resolve this debate or, more pointedly, answer the question of whether the judges' gender influences their decisions?
Certainly, we could talk with judges, interview lawyers, or closely read court decisions.
In a recent study, we took a different approach.
7
We collected data on 8,895 disputes resolved in federal circuit courts in the United States (called U.S. Courts of Appeals).
Our goal was to determine whether male and female judges reach different decisions—were the women more likely to vote for the party bringing a claim of sex discrimination?
Were they less likely to hold for the government in criminal cases?
And so on.
La Porta and his colleagues deployed a similar strategy in their famous study of whether independent judiciaries promote economic freedom.
8
In theory, there are good reasons to believe that judges endowed with some level of independence from the government can act as a check on the government's efforts to interfere with contracts and property rights.
9
La Porta et al. wanted to know whether this idea holds in practice.
To find out, they collected a lot of data on the degree of judicial independence and the level of economic freedom in seventy-one countries.
This was not the only possible approach.
They could have closely analyzed judicial decisions or talked with policy makers, citizens, judges, lawyers, corporate leaders, and financiers, to name just a few alternatives.
The La Porta et al. study and ours on gender are examples of empirical research, or research based on observations of the world or data, which is just a term for facts about the world.
10
The data we and La Porta et al. happened to collect were numerical or quantitative data; that is, we and they took information about cases and court systems (among other things) and translated the information into numbers that we analyzed using statistical tools.
In our study we begin with a large pile of court cases—8,895—and converted them into pre-established numbers: a decision in favor of the party claiming sex discrimination (the plaintiff ) became a "1"; a decision against the plaintiff was a "0."
But both studies could have used qualitative data, as we just hinted.
For example, we could have extracted information from the text of court decisions.
The data in this case would be words, not numbers, that we could interpret, organize into categories, and use to identify patterns.
This too would qualify as empirical research because empirical evidence (i.e., data) can be numerical (quantitative) or non-numerical (qualitative), despite some tendency in the legal community to associate empirical work solely with "statistics" and "quantitative analyses."
The truth of it is, neither is any more "empirical" than the other.
This holds to such an extent that almost everything we say in Parts I, II, and (some of) Parts III and IV of this book applies with equal force to qualitative and quantitative work.
11
So if the qualitative–quantitative division isn't all that meaningful for differentiating empirical projects from other types of legal research, what is?
Not the types of data deployed but the very idea of bringing data to the table is the chief point of distinction.
Think about it this way.
Many doctrinal studies, lawyers' briefs, and even judicial decisions start with a hunch
12 —what amounts to the author's best guess about the answer to a question concerning law and legal institutions.
Juries are biased against corporations, minorities receive harsher sentences in criminal cases, privately retained attorneys are more effective than public defenders, to provide just a few examples.
Empirical projects are no different.
We had a hunch that female and male judges reach different decisions.
La Porta et al. theorized that independent judiciaries are more effective at ensuring economic freedom.
In both, as in almost all empirical work, theory does (and should) play a crucial role in informing the analysis.
13
But neither La Porta et al. nor we stopped with our theories or hunches; we collected data to assess them.
This is not to say that ours or La Porta et al.'s or any other data project, for that matter, will end with data instead of the sort of policy recommendations or normative conclusions that often appear in traditional legal research.
On the contrary.
For reasons that we hope will become clear, well-executed research with a data component is likely to make more important, influential, and, frankly, better contributions to policy and law because the study's authors can accurately gauge the uncertainty of their conclusions.
1.2 Conducting Empirical Research in a World Without Constraints
Because most empirical studies contain theoretical and data components, it sometimes helps to visualize them as consisting of two transparent slides.
On the first slide we write down our hunches about the answer to a research question.
The second includes all the data we've collected to answer the question.
The (usual) hope is that when we put the two slides together (that is, when we analyze the data), they will align: the data will support our hunches.
We devote the rest of this book to describing how researchers go about creating the two (metaphorical) slides, aligning them, and communicating their contents.
Before moving forward, though, let's take a brief but important detour.
We want you to perform a thought experiment—one designed to illustrate the difficulty of this process, along with the work-arounds social scientists have developed.
The experiment is this: If you were endowed with the combined powers of the world's superheroes—the Avengers, Batman, Superman, Spider-Man, Wonder Woman, and all the rest—how would you create and match up the two slides?
To make the experiment more concrete, think about how La Porta et al. might have answered their research question about the effect of an independent judiciary on economic freedom if they were superhuman and had no constraints.
We can tell you what we'd do.
We'd start by randomly selecting a country from all the countries in the world.
14
Then we'd randomly assign the country a judicial type—say, an independent judiciary—and observe whether the country enjoys economic prosperity.
Next, we'd reverse time (remember, we're superheroes) to the precise moment we assigned the country a judicial type; only this time we'd assign the country—the same country—the other type: a judiciary lacking in independence.
If we observe the same level of economic freedom in both versions of the same country, we would conclude that the judiciary has no effect on the economy.
If we observe the version of the country with an independent judiciary flourishing economically and the version without an independent judiciary faltering, we'd conclude that an independent judiciary generates greater economic freedom.
Why would we proceed in this way if we had no constraints?
To arrive at the answer, consider the many other things that could affect whether a country will experience economic freedom other than the state of the judiciary.
A very short list might include the country's geography (the healthier the climate, the better the institutions and outcomes), ethnic heterogeneity (the more heterogeneity, the more likely that the ruling regime limits the production of public goods), and overall wealth.
15
Because we concocted a plan for comparing precisely the same country at precisely the same moment in time we don't have to worry about these other factors; we've held them constant so that we can focus on the factor of interest: the type of judiciary.
Of course, ours is a research plan that no mere mortal can ever implement.
Because we aren't superheroes, we can't assign a country a type of judiciary and then reassign it another; and we certainly don't have the power to rerun history.
This limitation is known as the fundamental problem of causal inference,
16 and it simply means that researchers can only observe the factual (e.g., the economic freedom of a country with an independent judiciary if, in fact, the country has an independent judiciary) and not the counterfactual (e.g., the economic freedom of a country without an independent judiciary if, in fact, the country has an independent judiciary).
17
Without being able to observe both the factual and counterfactual at the same time, we can never know for sure whether there is a causal effect of independent judiciaries on economic freedom.
(A causal effect is just the contrast between the factual and counterfactual, as we explain in more detail later.)
Unless (until?) humans develop the power to reverse time, this is a problem without a solution, but scholars have developed various fixes.
The gold standard solution is a proper experiment—that is, an experiment with two key conditions: the researcher (1) randomly selects subjects from the population of interest (all countries, in the La Porta et al. study) and then (2) randomly assigns the subjects to treatment and control conditions (a judiciary is or is not independent).
18
Very few experiments in empirical legal research satisfy the first condition (random selection from the population) but some scholars have tried to meet the second (random assignment of control conditions).
When the second condition is met, we can often compare the outcomes in the treatment and control groups to estimate the causal effect.
Rachlinski and his colleagues, for example, recruited (not randomly selected) bankruptcy judges to participate in an experiment designed to detect whether the race of the debtor affects their decisions.
19
The researchers asked the judges to read exactly the same case materials, but unbeknown to the judges, the researchers randomly assigned them to one of two groups.
The judges in the first group, the "control" group, were led to believe that the debtor was white; those in the second group, the "treatment" group, were led to believe that the debtor was black.
20
It turned out that the debtor's race did not affect the judges' decisions.
21
While this is a reasonable approach to the fundamental problem of causal inference, it is sadly infeasible for many empirical legal projects, including studies of judicial independence and economic growth (not many, if any, countries would allow us to assign them a legal system).
The Rachlinski et al. study aside, it is not even feasible for many analyses of how judges make decisions.
To return to our example of the effect of gender on judging, suppose we wanted to understand whether the presence of a female judge affects the decisions of her male colleagues.
22
We know of no court that would allow us to manipulate its composition so that we could identify a possible gender effect (and we've asked!).
Our original project of determining whether male and female judges reach different decisions faces an even higher hurdle because it's impossible to assign a gender to a judge to see if the male and female versions of the same judge reach different decisions.
1.3 Conducting Empirical Research in a World With Constraints
The upshot is that most empirical legal researchers simply do not have the luxury of performing experiments.
And even if we could conduct them, some would question whether they are worth undertaking.
A few judges we know cringe when they hear about Rachlinski et al.'s experiments, claiming they are too artificial to replicate decisions in a real courtroom.
23
For these reasons, the vast majority of studies of law and legal institutions make use of data the world, not they, created—the decisions reached by a female or a male judge in an actual case or the degree of economic freedom in actual countries with an independent or non-independent judiciary.
The problem is that the use of this sort of observational data substantially complicates the task confronted by empirical legal researchers.
24
To see why, think about the data we cooked up in our thought experiment, or that Rachlinksi and his colleagues generated in their lab.
Because these data were produced by the random assignment of an independent/non-independent judiciary (as in our thought experiment) or of black/white debtors (as in Rachlinski et al.'s), they minimize the effect of other factors on economic freedom or the judge's decision.
The same cannot be said of observational data.
In our study of gender and judging, something else—surely not us—assigned a gender to the judges; the same holds for La Porta et al.'s analysis of economic freedom.
When the assignment of subjects to treatment and control groups is determined by the world and not the researcher, as it is in our study of gender of judging, it makes it difficult to determine whether gender or other factors could lie behind the differences in judicial decisions we observe in the data.
So what do we do?
We attempt to approximate as closely as possible our thought experiment by taking three steps: (1) designing our project, (2) collecting and coding data, and (3) analyzing the data.
25
We also think researchers should (though they don't always) take a fourth, which entails giving careful consideration to how to present results.
These four steps or, more accurately, components of the research process are the focus of the chapters to come and so require only a preview here.
26
The important thing to keep in mind is that their purpose is to move us as close as possible to our superhero experiment.
1.3.1 Designing Research
Designing research principally, though not exclusively, involves the process of moving from the conceptual to the concrete to clarify the project.
To return to the La Porta et al. study, the researchers had a hunch that the more independent the judiciary, the greater the country's economic freedom.
However plausible this hunch, it's impossible to assess on its face because "judicial independence" and "economic freedom" are both concepts that we cannot observe.
A design challenge confronting La Porta et al.—and indeed virtually all empirical researchers—was to define these concepts in concrete terms so that they could observe them.
They met the challenge by defining judicial independence (in part) by the tenure of the country's judges.
They created a scale such that tenure = 2 if judges serve for life, 1 if tenure is more than six years but not for life, and 0 if tenure is less than six years.
27
The researchers clarified economic freedom, their other key concept, through four indicators: a subjective index (which ranges from 1 to 5 in their data) of the security of property rights; the number of steps that a start-up business must take to obtain legal status (from 2 to 19 in their data); a scale of worker protection through labor laws (from .77 to 2.31); and the share of the assets of the country's top banks owned by the government (from 0 to 1).
28
These were not the only concepts requiring clarification by La Porta et al.
Because they aren't superheroes and couldn't reverse time or randomly assign legal systems to countries, they had to consider all the other factors that affect economic freedom—the country's wealth and climate, for example.
These and many other possibilities had to be clarified too.
In their study, a country's wealth became per capita gross domestic product; climate was the absolute value of the country's latitude.
A question you might ask is why these definitions, and not others?
For example, you might think that a country's average temperature is a better measure of its climate, or that judicial independence relates more to legal provisions preventing the government from reducing the judges' salaries than to the length of their terms.
There is no automatic answer.
The choice of which proxy (or proxies) is not just a crucial part of the design process; it is a choice that researchers must justify with reference to accepted criteria.
We explore these in Chapter 3.
1.3.2 Collecting and Coding
The long and short of it is this: before researchers can answer legal questions empirically—actually before they can collect even the first piece of data—they must devise ways to clarify the concepts of interest so that they can observe them.
All of this and more appears on that first (metaphorical) transparent slide.
Collecting and coding data are the makings of the second slide.
Collecting data entails several steps, beginning with a consideration of the possible sources of information necessary to answer the research question and the methods available to extract the information.
There are numerous possibilities, from interviewing people to analyzing documents, and we consider many in Chapter 4.
The researcher must also contemplate whether to study all the elements of interest (e.g., all countries, all cases) or draw a sample of them; and, if the latter, how to draw the sample as well as how much data to collect.
The La Porta et al. study and ours on gender display some of the options.
We drew samples of cases decided by the U.S. Courts of Appeals; they studied all seventy-one countries (with stable economies) whose constitutions were included in the book, Constitutions of the Countries of the World.
29
Chapter 4 examines these and other alternatives for selecting data.
Once researchers decide how and how much data to collect, they must code the data—that is, translate information into a usable form for analysis.
For our study of the effect of gender on judicial decisions, we began with piles and piles of judicial decisions (or, more accurately, thousands of pdfs on a hard drive).
If we were unable to transform those piles into data that we could analyze—that is, to code the cases—we would have been unable to proceed with our study.
Ditto for La Porta and his team.
To assess the length of judicial tenure, they started with legal documents, mostly laws and constitutions.
It was the information in the documents that required translation.
There is some art to collecting and coding data but, frankly, the science part is more crucial.
For the reasons we explain in Chapter 5, following some time-honored standards will yield high-quality results, as well as save time and resources.
1.3.3 Analyzing Data
If research design is the first transparency, and collecting and coding data the second, then data analysis is about comparing the two.
When the overlap between the hunches and data is substantial, analysts may conclude that the real world confirms their hunches; if the overlap is negligible, they may go back to the drawing board or even abandon the project altogether.
This process of comparing the slides—analyzing data—typically involves two tasks.
The first amounts to summarizing the data the researcher has collected.
For our gender study, suppose we drew a random sample of 1,000 cases of employment discrimination out of a total of 10,000 decided in the U.S. federal courts.
For these 1,000 cases, we might summarize the data by comparing the fractions in which a male versus a female judge voted for the party alleging discrimination.
As you already know, La Porta et al. also summarized their data.
When we described how they clarified the concepts in their hunches, we gave you their ranges; for example, for the countries in their dataset the number of steps that a start-up business must take to obtain legal status ranges from 2 to 19.
The range too is a way to summarize data.
Generating fractions or ranges requires only school-level mathematics.
No specialized training is needed if all you want to do is summarize data (or understand reports of data summaries).
30
The more typical goal of data analysis, however, is far more difficult to achieve.
It is the goal of making statistical inferences, which means using facts we know or can learn (for example, the decisions of the courts in our sample of 1,000 cases) to learn about facts we do not know (decisions in all 10,000 cases).
Because we spend many pages on inference in Part III, suffice it to make two points here, on (1) the types of inference and (2) the task of performing inference.
The Types of Inference.
In empirical research, statistical inference comes in two forms: descriptive and causal.
Descriptive claims themselves can take several forms but, at first blush, most seem to bear a family resemblance to summarizing data.
Return to the La Porta et al. study, which proxies economic freedom (in part) as the number of steps a start-up business must take to obtain legal status.
Now suppose that across all 71 countries, the average number is ten.
This figure of ten probably isn't all that interesting in and of itself to most of us.
What we want to learn about is the number of steps in all 195 countries in the world.
31
This is the task of drawing a descriptive inference.
We do not perform it by summarizing facts; we make it by using facts we know—the small part of the world we have studied (the 71 countries in La Porta's)—to learn about facts we do not observe (the 195 countries).
Researchers call the "small part" a sample and the "world" a population.
(An important part of performing descriptive inference is quantifying the uncertainty we have about the inference we draw. We'll get to this in a minute.)
Causal inference too is about using facts we know to learn about facts we do not know.
In fact, with observational data a causal inference is the difference between two descriptive inferences: the average value of whatever it is we are trying to explain, say, economic freedom (as measured by the number of steps) when there is an independent judiciary and when there is not.
Because each country either does or doesn't have an independent judiciary, we can only observe the factual and not the counter-factual.
The causal effect—the goal of the process of causal inference—is the difference between the factual and the counter-factual, here the difference between the number of steps when a country does or does not have an independent judiciary.
As we'll see later on, making this comparison requires a careful research design and appropriate tools to perform it.
32
The Task of Performing Inference.
How do empirical researchers go about making descriptive or causal claims?
In many studies, as we just suggested, they make use of statistical inference, which entails examining a sample to learn about the population, along with evaluating the quality of the inference they reach.
Conceptually, statistical inference is not all that hard to understand; in fact, we confront such inferences almost every day in the form of survey results.
Consider a Gallup poll that asked people living in one of the 27 member countries of the European Union (EU) whether they "feel safe walking alone at night in the city or area that you lived."
Of the respondents, 69% answered yes.
33
To arrive at the 69% figure, did Gallup talk to all 500+ million people living in EU countries?
Of course not.
Their researchers drew a sample of about 1,000 people per country, for a total of about 27,000.
And from this sample they drew an inference (in this instance, a descriptive inference) about the percentage of people who feel safe walking alone at night.
Now, it is one thing to say that 69% of the respondents in the sample feel safe (this is summarizing or describing the data); it is quite another to say that 69% of all citizens in EU countries feel safe.
So how did the researchers at Gallup go about making the statistical inference that 69% of the 500+ million, and not merely the 27,000 in their sample, feel safe?
It turns out that all they—or any empirical researcher—need do is tally (i.e., summarize) the responses to their survey.
That's because our best guess about the views of the population is also 69%, assuming the sample has been properly drawn.
We explain why in Chapter 6.
But there's more.
We know that Gallup interviewed only a sample and not the entire population so, surely, there is some uncertainty about the 69% figure.
Gallup expresses the uncertainty in terms of a margin of error, which for this poll is about 95% CI ± 4.
34
Non-technically, this means that we can be 95% confident that the percentage of all respondents believing they are safe in the neighborhoods lies somewhere between (69% - 4% =) 65% and (69% + 4% =) 73%.
(More technically, we would say that the true percentage of people feeling safe will be captured in 95 out of 100 applications of the same procedure to sample from the population and to compute the margin of error.
But don't worry about this now.
We'll get to it in Chapter 7.)
This example shows that statistical inference involves not merely estimating the quantity of interest—the fraction of people who feel safe or the number of legal steps for start-ups in the La Porta et al. study—but also our level of uncertainty about the inference.
Gallup and most other pollsters typically report the margin of error; empirical legal researchers use many other measures of uncertainty, and we explore some of the most prominent in Part III.
Even from this brief discussion, we hope that you see that inference is easy to understand as a conceptual matter.
Performing it is harder.
This is especially true of causal inference, which some say is so difficult with observational data that we should never frame research in terms of causality; we should talk only about associations.
Rather than say an independent judiciary causes greater economic freedom, we should say that an independent judiciary is associated with greater economic freedom.
We disagree.
Yes, causal inference is hard but it's not impossible.
Besides, scholars, lawyers, and judges need to make causal claims and so giving up is not an option.
What we advise instead is that researchers proceed with great care.
35
To this end, in Part III we provide the statistical tools to begin to perform and understand inference.
The tools we describe presuppose that the study is well designed and the data are up to the task.
If the design is poor or the data are inadequate, researchers can't reach inferences of high quality, nor will they be able to assess their uncertainty (e.g., the 95% CI ± 4 in the Gallup poll) about the inferences they reach.
Without a proper design no statistical method can provide reliable answers.
The broader lesson is this: if the goal is to make causal inferences, researchers should not be deterred (nor should judges and lawyers be wary) assuming they follow the best scientific practices.
Those include practices not just for statistical analysis but for design (Part I) and data collection (Part II) as well.
1.3.4 Communicating Data and Results
Once analysts have drawn inferences from their data, they must present their results so that others can understand them.
To a greater extent than other components of the process, effective communication blends art and science.
It also requires careful consideration of the intended audience.
Many treatments of empirical research neglect this component in the hope, we suppose, that researchers will figure it out for themselves.
But we think the omission is such a big mistake that we devote two chapters to the topic (Chapters 10 and 11).
Why?
Two reasons.
First, legal scholars (perhaps more than most others) hope to affect the development of law and policy.
We certainly do.
We want judges, lawyers, and policy makers to read and understand our work.
The problem is that these people often lack any training in empirical methods and so have trouble translating the results into meaningful information.
This is as regrettable for them (they will miss out on research that may bear directly on their concerns), as it is disappointing for the scholar who invests time and resources into producing high-quality, policy-relevant work.
Happily, though, the problem is completely avoidable because scientists have made substantial progress in developing approaches to convey empirical results in accessible ways—progress facilitated by the revolution in micro-computing and statistical software.
By providing information and examples of these advances, we hope that researchers will take advantage of them.
Both they and their audience will be the beneficiaries.
This takes us to the second reason for our emphasis on communicating results.
The advances can be abused, resulting not in more accessible and elegant forms of communication but in messy and even misleading graphs.
We offer guidance to help researchers create useful (and truthful) data displays.
1.4 (Revisiting) The Goals of Empirical Research
Almost all empirical research seeks to accomplish one or more of three ends: summarizing data, making descriptive or causal inferences, and creating public multi-user datasets.
We have already discussed the first two, with emphasis on inference because inference is the ultimate goal in most empirical studies (and so the focus of this book too).
Still, we think it's worthwhile to say a word or two about the creation of public multi-user datasets as a research objective.
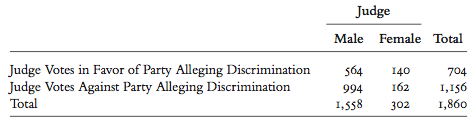
Table 1.1 Crosstabulation of U.S. Court of Appeals votes in a sample of sex discrimination cases over the gender of the judge.
36
In some sense, creating public datasets resembles collecting and coding data, that is, translating or amassing information in such a way that researchers can make use of it.
This is a component of almost all empirical projects, but the goals of public or multi-user databases tend to be different.
37
Rather than collect data to answer particular research questions—for example, do male and female judges reach different decisions?; do independent judiciaries lead to greater economic freedom?—the idea is to amass a dataset so rich in content that multiple users, even those with distinct projects, can draw on it.
In addition to opening access to many researchers, large multi-user databases have what is known as a combinatoric advantage.
To see this, consider one useful method of analyzing data, the crosstabulation, or a table that summarizes information about various quantities of interest.
Table 1.1 provides an example.
There we show a sample of votes cast for or against the party alleging sex discrimination in cases before the U.S. Courts of Appeals, by whether the judge is a male or a female.
Note that the table produces four "cell" values: the number of votes in favor of the party alleging discrimination when the judge is a male (n = 564) and when the judge is a female (140); and the number of votes against when the judge is a male (994) and when the judge is a female (162).
38
The important point is that the two factors most relevant to our project—the judges' votes and their gender, each with two categories—produce information on (2 × 2 =) 4 cells.
Now suppose another team of researchers comes along and they too want to study votes in sex discrimination cases.
What they want to know, though, is whether the judges are more likely to affirm (rather than reverse) the lower court's decision.
So now we have two teams of researchers both interested in sex discrimination cases but focused on different factors to explain votes: us, on the judge's gender (male or female) and them, on the lower court's decision (for or against the party alleging discrimination).
Further suppose the teams are not working together, but rather each drawing its own sample and collecting data on the factor of interest (gender for us and the lower court's decision for them), along with three other factors each team suspects affect judges' votes; that is, each team selects its own three factors.
The result is that crosstabulations for each study could produce as many 32 cells.
Note, though, that because we and the other team drew our samples independently, crosstabulations of the factors in one sample with the factors in the other wouldn't be possible.
Combining them would amount to mixing apples and oranges.
Now consider what would happen if we and the other team joined forces and collected the ten factors on the same set of cases in one large dataset.
A combinatoric advantage accrues: if the ten factors were collected on the same cases, the ten factors of two categories each would generate 210 = 1, 024 different cells, or
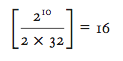
times as much information as the two independent databases produced separately.
Aware of these advantages, researchers have created many multi-user databases related to law and legal institutions worldwide.
39
Because Chapter 4 describes some of the more influential ones, two examples suffice for now: the Comparative Constitutions Project,
40
which houses information on the characteristics of constitutions written since 1789 in 184 countries; and the U.S. Supreme Court Database,
41
which contains over 200 attributes of Court decisions handed down since 1946, including information on the lower court's decision, the parties to the suit, and how the justices voted.
The researchers who developed these databases have made extensive use of them, but so too have a multitude of other scholars—including ourselves.
Throughout this book we employ these and other multi-user datasets to illustrate particular concepts, statistical techniques, and methods for communicating research results.
Even so, it is important to keep in mind what we said at the beginning of this section.
Despite the many advantages of multi-user databases, they are, after all, just datasets.
To have value, they must meet the standards of good science no less than those developed for a particular research project.
∗∗∗∗∗∗∗∗
With this, we've finished our introduction to the contours of empirical legal research.
It's now time to flesh them out.
